
Ito runs a QA pipeline against every pull request in the repositories we watch: test-runner agents execute planned test batches in devcontainers with a real browser. That agent is our largest LLM cost. From March through June it ran on GPT-5.3-codex; in late June we migrated it to MiniMax M3, through which it now pushes roughly 100 billion tokens a week. Because we meter every agent step, the migration gave us a clean natural experiment: over half a trillion tokens of production traffic, both models on the same workload.
Terms, since we use them throughout: a run is everything we do for one pull request; a step is one agent execution within a run (for the test-runner, one batch of planned tests, so a run contains several); a turn is one model call within a step.
This post is the guide we wanted when we started: what open-weight economics look like in production, and where the difficulty actually lives. It is not the model.
The savings are real
Median LLM cost per pipeline run fell 55%. The whole distribution moved, not just the median: the per-step median fell 60%, the 90th percentile 36%, the 99th 17%.
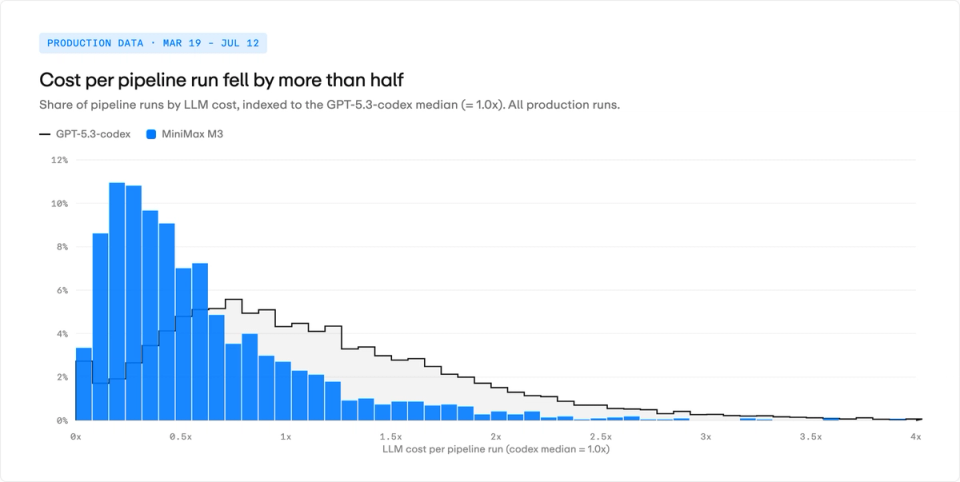
The cutover took 11 days, staged repository by repository, with a same-day revert path. Weekly spend fell roughly 28% while workload volume grew about 8%.
The aggregate hides a wide spread. Within the same repository, MiniMax's median step cost ranged from 19% to 87% of its codex-era median. Context-heavy repositories with long agent sessions benefit most, because cheap cache reads dominate their bill.
Cheap tokens are not efficient tokens
On matched workloads (156 succeeded steps per model, drawn from the same fixed set of repositories), the model we adopted does more of everything except cost:
| Median per test batch | GPT-5.3-codex | MiniMax M3 | Ratio |
|---|---|---|---|
| Agent turns | 94 | 116 | 1.23x |
| Output + reasoning tokens | 21,500 | 46,800 | 2.18x |
| Input tokens (incl. cache reads) | 5.4M | 13.5M | 2.51x |
| Cost (indexed to codex = 1.0) | 1.0 | 0.46 | 0.46x |
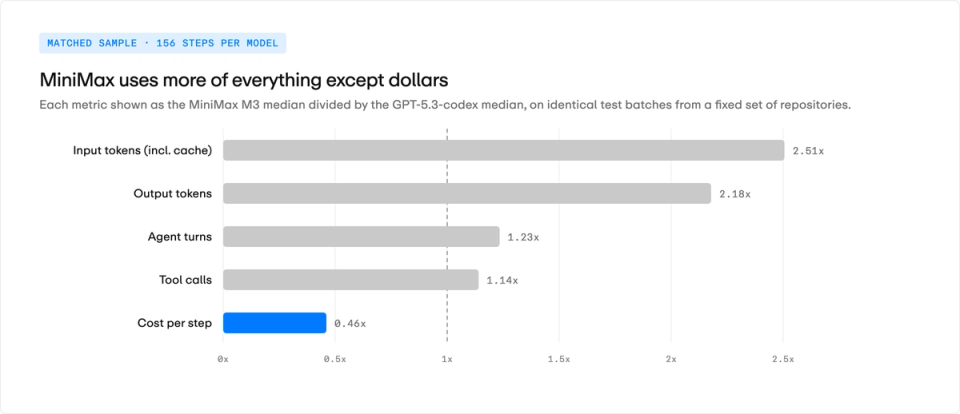
An evaluation ranked on turns or tokens to completion would have chosen codex. Our invoices chose MiniMax: at 3–12x lower per-token prices, the inefficiency is absorbed with room to spare.
One accounting note: codex's effective output rate ran about 58% above its list price, because reasoning tokens are billed as output but excluded from visible token counts. Derive effective per-token rates from your invoices, not from pricing pages.
The same model is not the same model on a different provider
This is the part no public benchmark told us. “Open weights” suggests a commodity: the same model wherever you buy it. In practice, sampling settings, quantization, context handling, and above all prompt-cache behavior vary by provider, and most of those parameters are not visible to you.
We tested GLM-5.2 and MiniMax M3 on Vercel AI Gateway, OpenRouter, and Together AI. Vercel had by far the worst cache hit rate for both models, and scored worst on our internal evals against the same underlying providers reached through OpenRouter.
Aggregators add a second copy of the problem. OpenRouter can route to Together AI, but the cache rate and reliability we measured through that path were dismal compared to calling Together AI directly. Same weights, same named provider, different behavior, depending on the layer in between. Our working hypothesis is that serving settings do not survive the trip through aggregation layers intact. We ended up cutting out the middlemen and integrating with Together AI directly.
For agent workloads, cache behavior is not a nicety. About 97% of our input tokens are cache reads; a provider that quietly degrades caching multiplies your bill.
One constraint worth stating plainly: our shortlist was limited to providers that meet our SOC 2 commitments for handling customer code. A provider you cannot clear through compliance review is not on your list, whatever the benchmarks say.
What the savings cost
Median step duration rose from 23 to 29 minutes, with a heavier right tail. Steps ending in a failed state roughly doubled, from 2.4% to 4.5% of terminal states. Retries absorb most of these before they are user-visible, but they are part of why realized savings (55%) are smaller than the raw price gap (3–12x).
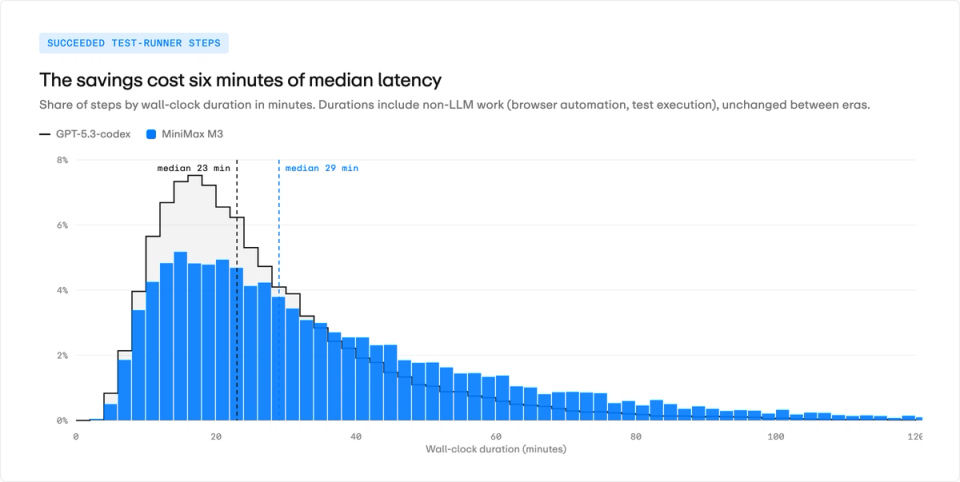
For background QA pipelines, six extra median minutes cost no one's attention. An agent in a developer's inner loop would weigh the same numbers differently.
The playbook
- Shortlist providers through compliance first. SOC 2 and data-handling commitments eliminate options before performance is ever measured.
- Evaluate the provider, not just the model. Run your own evals per provider and per routing path. Assume nothing transfers.
- Watch cache hit rate above everything. For agent workloads it is the largest cost lever, and the first thing aggregation layers degrade.
- Go direct once you have chosen. Every layer between you and the weights is a place where serving settings get lost.
- Derive effective per-token rates from invoices. List prices miss hidden reasoning billing.
- Stage the rollout on production traffic, per workload. Our per-repository savings varied 4x. Keep a same-day revert path.
Methodology: cost figures from our production billing artifacts and database, March 19 – July 12, 2026. The rollout was staged by repository rather than randomized; workload-sensitive comparisons are within-repository before/after. Turn and token comparisons use a matched sample of 156 steps per model drawn from the same fixed set of repositories. Step durations include non-LLM work, unchanged across the migration. Effective per-token rates estimated by least-squares regression of step cost on token counts (residual error under 2%).
Related resources.

AI Code Review on GitHub: Automating PR Review Without Writing a Test Suite
Get behavioral feedback on every GitHub pull request before you write a test suite. Learn how to set up runtime PR review and where human judgment still decides the merge.

The Electrification of Factories: What Software Teams Can Learn From the Transition
Factory electrification reshaped production only after owners redesigned the floor. AI software teams need the same shift in workflow, review, and verification.

Bug Catch of the Week: How a Failed Database Swap Could Delete Your Only Copy
DoltLite's replacement flow could delete the old database before the new copy was safe. Here's how runtime testing exposed the failure path before release.
Your first PR tested within 60 minutes.
Connect your repo and Ito starts testing pull requests right away. Each PR includes a full QA report with video, screenshots, and failure details directly in the PR.
no credit card required